Stock Market Candlestick Chart
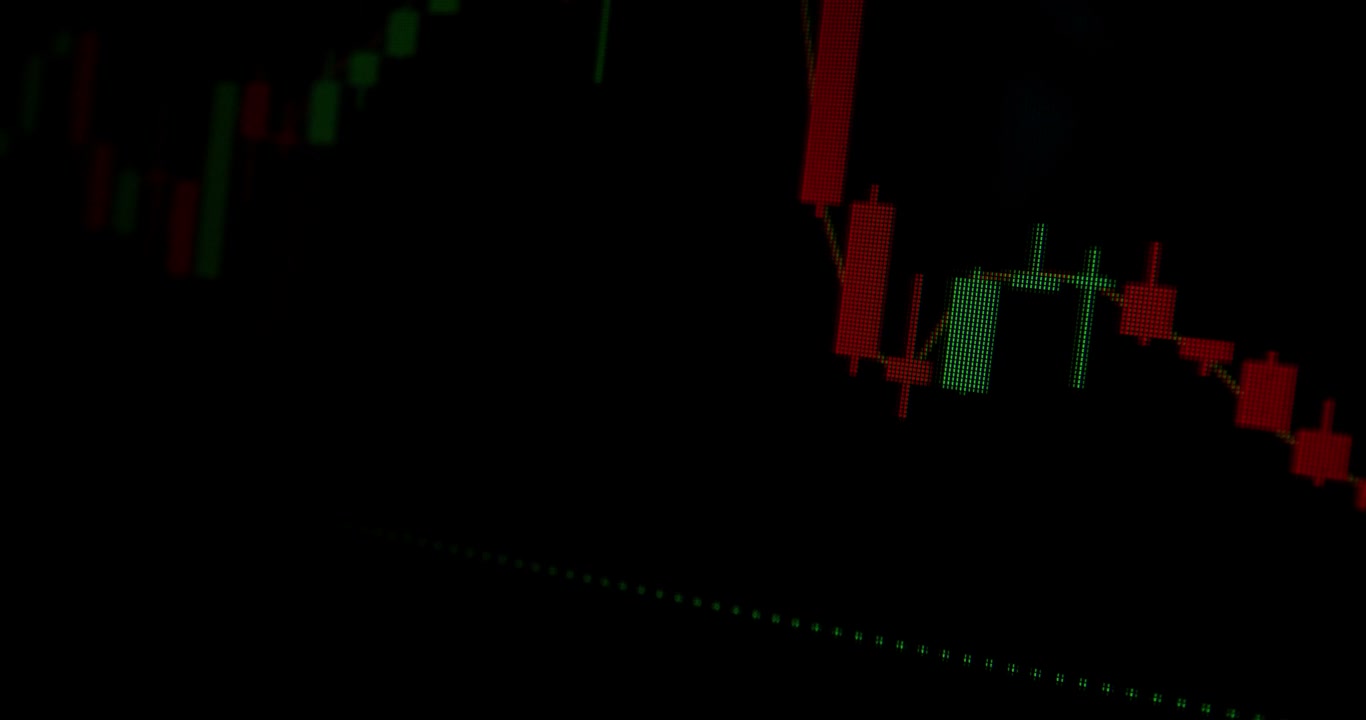
m-art productionA close-up view of a digital screen showing a dynamic stock market chart with green and red candlesticks illustrating price fluctuations over time.

A close-up view of a digital screen showing a dynamic stock market chart with green and red candlesticks illustrating price fluctuations over time.