Authenticity and the future of creativity: The Uppbeat Creator Report is here.
Uppbeat

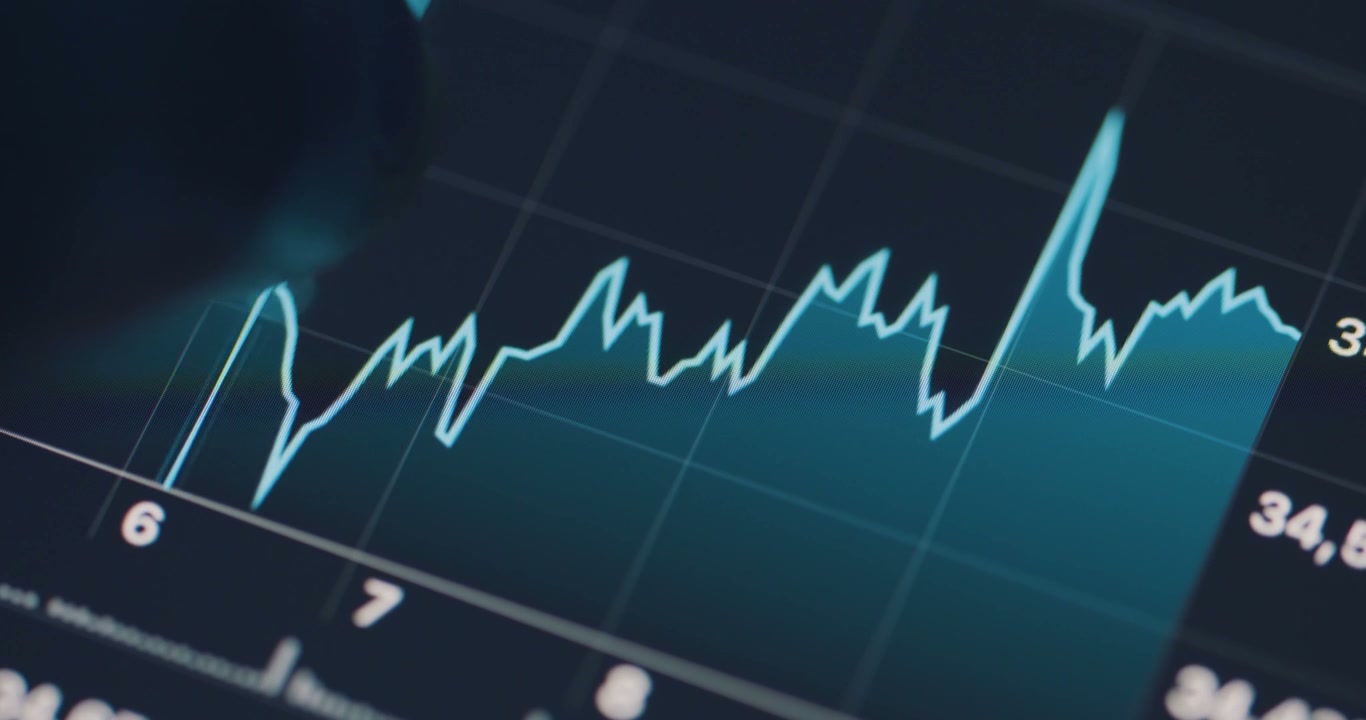
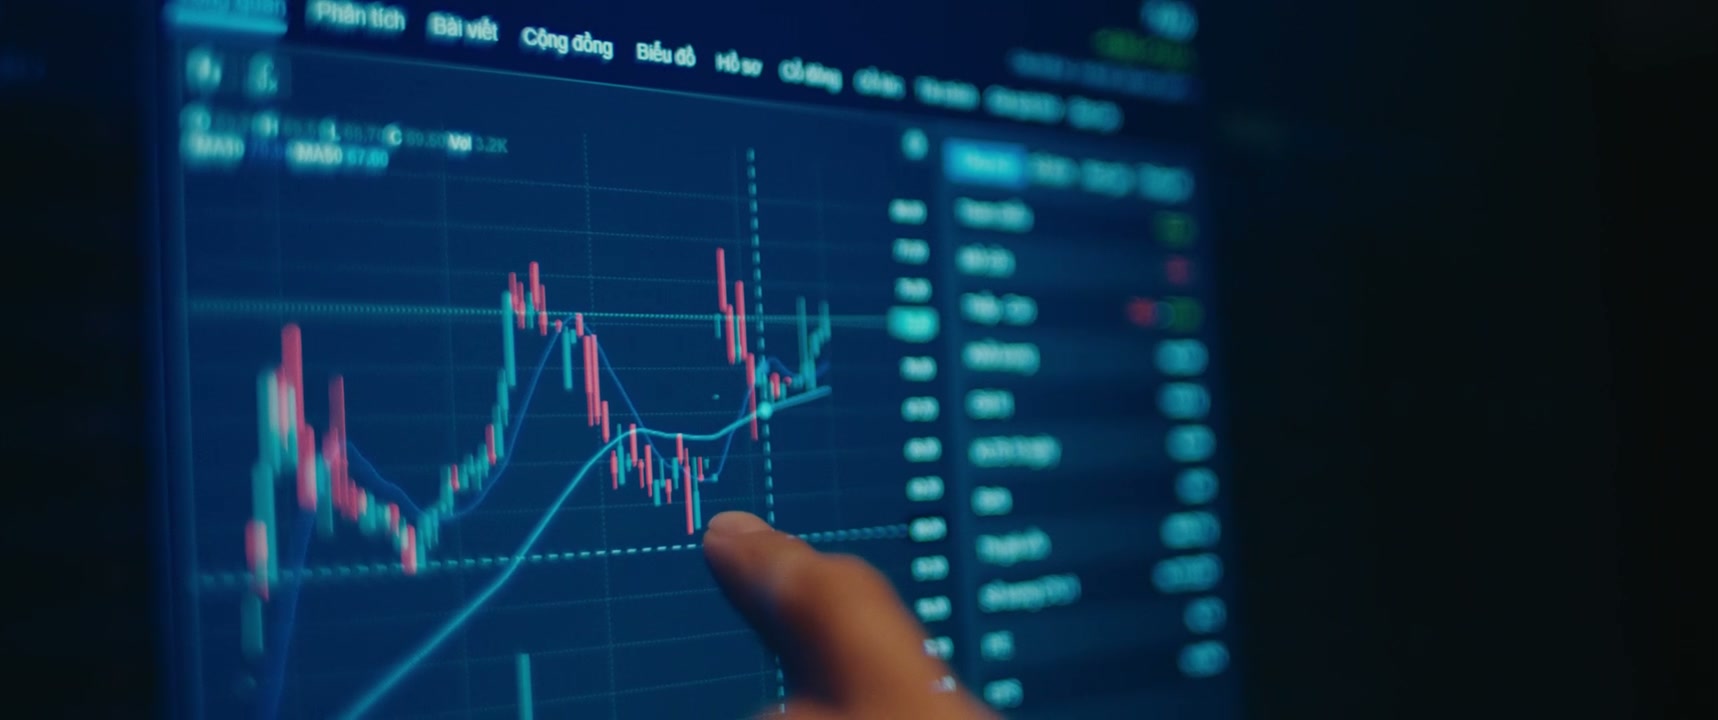
Analyzing Stock Market Data on Digital Screen

Arthur Cauty

A finger interacts with a digital display, touching and moving across a blue line graph representing stock market data and financial trends.

From this shoot

Finger Touching Financial Graph on Screen
0:00
Filmed by Arthur Cauty
Digital Stock Market Chart Fluctuation
0:00
Filmed by Arthur Cauty
Digital Financial Data Line Graph
0:00
Filmed by Arthur Cauty
Finger Scrolling Financial Market Graph on Phone
0:00
Filmed by Arthur Cauty

You may also like

Person Analyzing Stock Market Data
0:00
Filmed by Phong Tran
Person Analyzing Stock Market Data on Tablet
0:00
Filmed by Ami Bornstein
Candlestick Chart Financial Data Analysis
0:00
Filmed by Arthur Cauty
Hand Analyzing Stock Market on Tablet
0:00
Filmed by Ami Bornstein
Digital Stock Market Candlestick Chart
0:00
Filmed by Arthur Cauty
Financial Trading Chart Data Display
0:00
Filmed by Arthur Cauty
Analyzing Stock Market Chart
0:00
Filmed by Phong Tran
Hand Scrolling Financial Chart on Tablet
0:00
Filmed by Ami Bornstein
Trader Viewing Stock Market Data on Screen
0:00
Filmed by Phong Tran
Analyzing Stock Market Chart on Tablet
0:00
Filmed by Ami Bornstein
Financial Market Data Display
0:00
Filmed by Arthur Cauty
Finger Scrolling Stock Market Charts on Mobile Phone
0:00
Filmed by Kristian Kettner