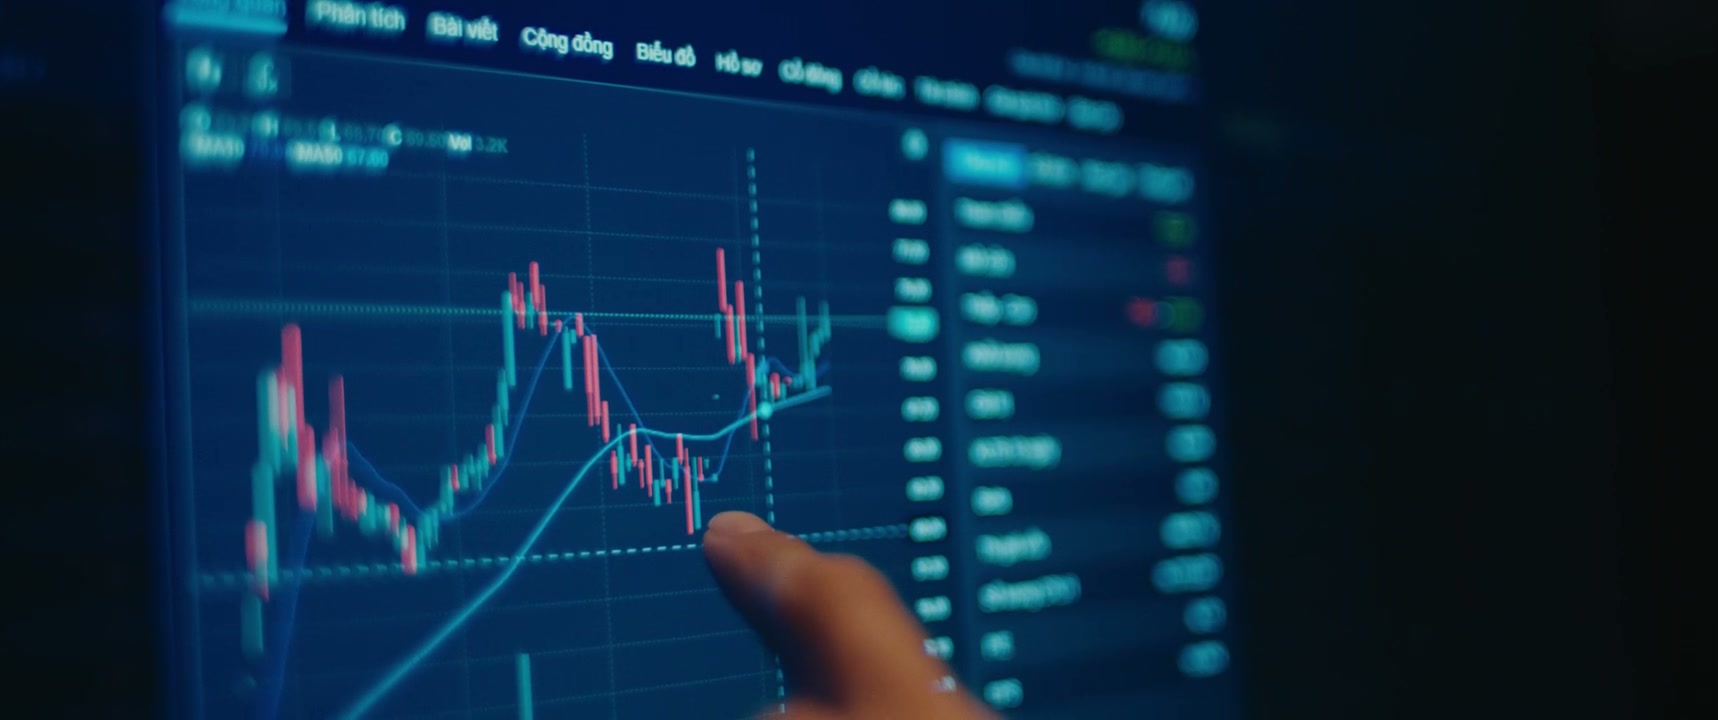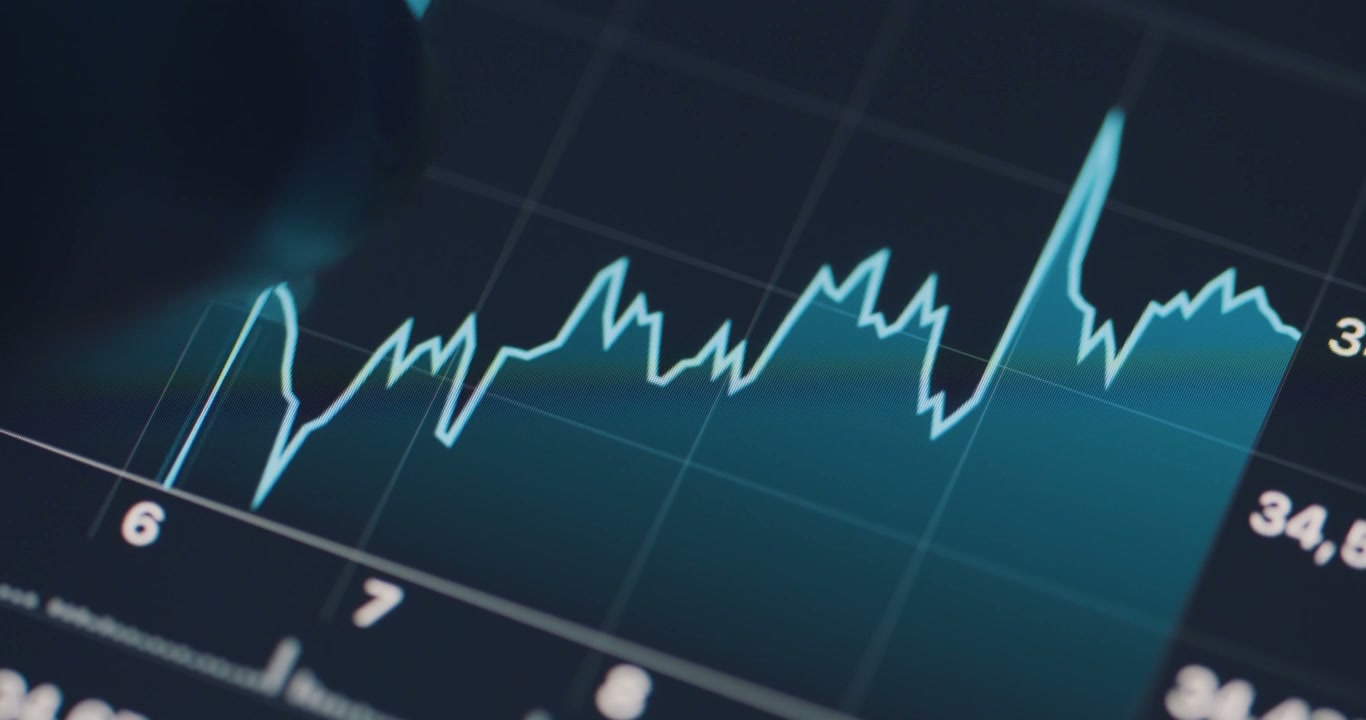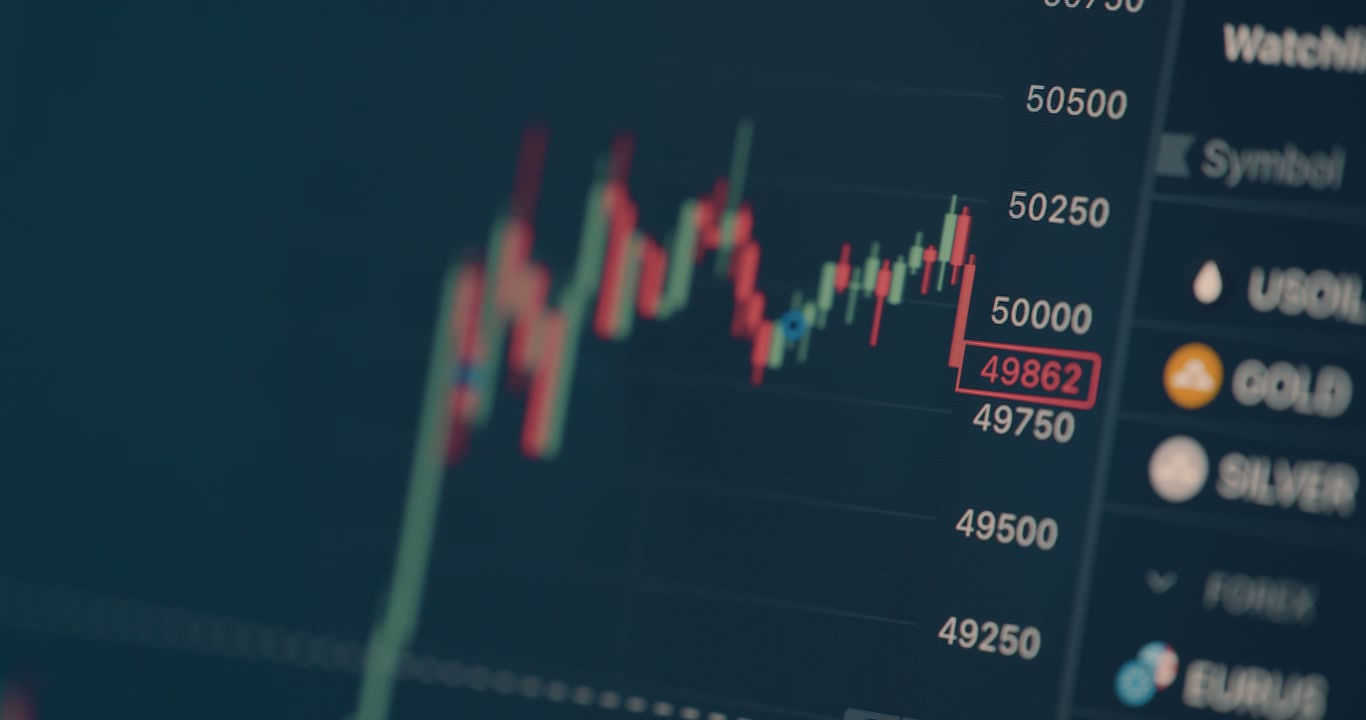
Finger Touching Financial Graph on Screen
Arthur CautyA close-up view shows a fluctuating red line graph on a digital screen, which turns teal as a finger interacts with it, representing financial market data.

A close-up view shows a fluctuating red line graph on a digital screen, which turns teal as a finger interacts with it, representing financial market data.